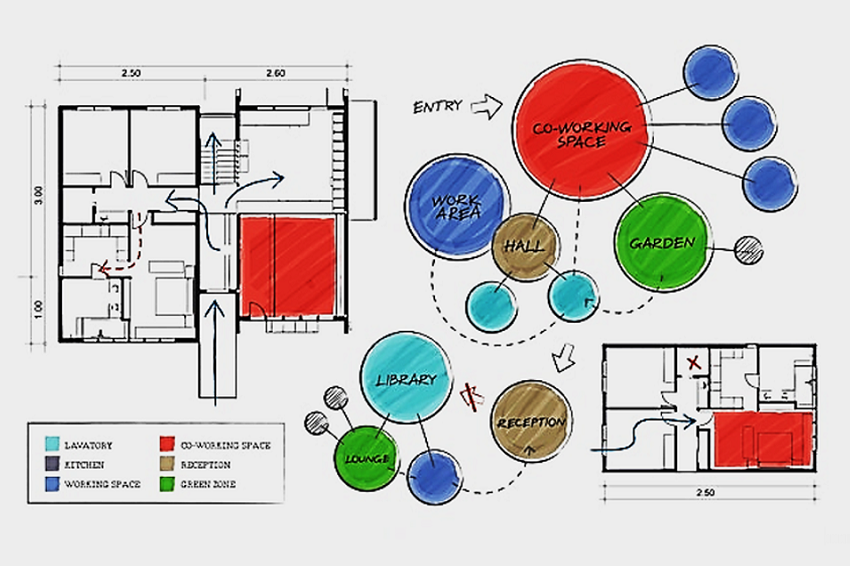
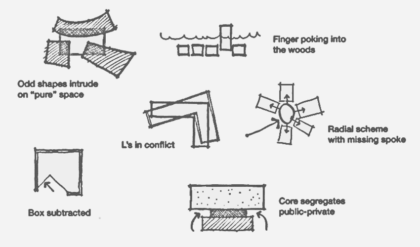
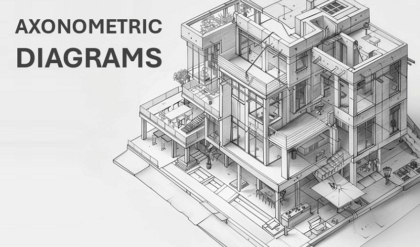
Bubble diagrams are one of the most effective tools that are used in both architecture and design works, urban planning, and other fields to illustrate relations between spaces and their hierarchical structure. These diagrams are most helpful in pre-bachelor concepts since they facilitate the display and arrangement of complicated data to the stakeholders. This tutorial opens with an explanation of the purpose and use of bubble diagrams as well as presenting the step-by-step guide of how to create bubble diagrams.
Understanding Bubble Diagrams

If a bubble is drawn individually, it is characterized as a simple form of graphic that employs circles or ovals to represent the proposed elements or spaces of a project. With the size representing the relative significance or size of the space and the interconnecting relationships between bubbles signifying the connection between such areas. Bubble diagrams are essential in illustrating spatial relations hence providing clients and designers with a feel of how the various zones shall be aligned in the given space.
Key Features of Bubble Diagrams
- Simplicity: This is a virtue because no complex concept or idea is difficult to decipher once drawn on the bubble diagrams since it only involves the use of shapes and lines.
- Scalability: It also has scale, being versatile and can be implemented on a small-scale interior design or a big scale urban design.
- Reusability: These diagrams are ideal to be used in the early stage of the project development and are flexible such that several changes can be made along the process.
Applications for Bubble Diagrams
- Architecture: Applied in determination of what the structure of the building is like, especially in relation to other parts of the building.
- Urban Planning: It assists in showing the placement of a considered elements in urban setting such as parks, homes, and business segments.
- Interior Design: Helps in arrangement for furniture and fittings in a room.
- Information Design: Could be used to depict relations between the data in such fields as sociology or biology.
Steps to Create Bubble Diagrams
Learn how to create bubble diagrams for a variety of purposes utilizing the following step-by-step instructions.
Step 1: Define the Scope and Objectives
However, it is essential to define what the process is for along with its goals to start the actual creation process. This step involves identifying the purpose of creating the bubble diagram you have in mind. Is it the construction of a new building, interior redesign, or do you need to find an optimal method of data representation? Next, it is evident that the goals should be well elucidated since they will direct the rest of the process.
- Elements of Interest: Write down all elements/space which has to be depicted in the context of the diagram.
- Understand How They Are Coordinated: Define interconnection is based on hierarchy or sequence or both or on geographical proximity.
Step 2: Gather Information
It is important to gather all the information that relates to the bubble diagram for an effective design to be developed. This relates with its physical dimensions, the functional interdependence, and any limitations in the layout.
- Space Requirement: Find out how much space is needed for each of the element.
- User Interactions: Get an understanding of how some parts of the design will function with in relation to other parts of the design.
- Constraints: Identify any limitations, such as existing structures or regulatory requirements.
Step 3: Sketch Preliminary Layouts
It is best to begin with loose drawings to decide the positions of components. This step involves arranging the contents to settle for the arrangement that captures the relations and importance of the project well.
When developing an idea, the simplest option is a set of circles or ovals for each element to convey the concept.
- Adjustable Arrangement: Shown below is a way to organize the bubbles but they can be dragged and dropped into other formations.
- Close Elements: They should be placed closer to one another than those which are not related.
Step 4: Refine the Layout
After you have made an approximate layout, analyze it to be more accurate in portraying the relationships and importance of your project.
- Element Size: Increase or decrease elements’ size to underline their significance or area.
- Connect: Join the bubbles using lines to make it easier for the reader to identify the flow or other connections, such as top bottom, or side-to-side.
- Constraint: It is necessary to apply the restrictions concerning space and legislation.
Step 5: Add Details and Annotations
To improve the bubble diagram, it is possible to add insertions that describe in more detail what is illustrated in the graph.
- Bubble Labelling: It is very crucial to label each bubble in a meaningful way that can help you to identify the element later on easily.
- Different Line Styles: As a rule, the use of lines, which might be perpendicular, dotted, dashed or of different thickness should reflect several types of relationships.
- Annotations: It may be necessary to highlight some of the features of the diagram by including annotations such as notes like developing annotations.
Step 6: Review and Iterate
Ensure you have well labeled your bubble diagram to express the relationship and the priority between the two elements of a task. This is through soliciting the opinion of various stakeholders and then making corrections where necessary.
- Get Input: It is advisable to share this type of diagram with other people especially with those involved in the same project as them to receive their comments.
- Review: Review of the diagram as it stands depends on the expectations of the instructor or additional information that the learner has come across later.
- Iterate: Sometimes it might take some time to get the best layout in terms of the design or even the arrangement of the windows, components, icons, and toolbars, etc.
Tools for Creating Bubble Diagrams
There are many resources which can be used for creating bubble diagrams, both manual and digital. Here are some popular options:
Traditional Tools
- Paper and Pencil: Sometimes, there is nothing better than a classic – plain paper and pencil can be used in the first stages of designing.
- Whiteboards: Which is quite useful when holding sessions and discussions as the drawing can be made by one person yet edited by several individuals.
Digital Tools
- Software: Application such as Auto CAD or Sketch up are useful to design layer bubble maps with correct measurements.
- Graphic Design Software: Tools like Adobe Illustrator or Photoshop offer flexibility in design and presentation.
- Interior Design and Architectural Layout Software: There is a variety of software that is specifically designed for the Interior designing and architectural layouts such as the Space Designer or the RoomSketcher.
- Bubble Diagrams: Even if a tool is not specifically designed for bubble diagrams, it is possible to draw them with MindMeister or XMind.
Tips for Effective Bubble Diagrams
Drawing a bubble diagram is more than just a mere task of placing bubbles and lines with texts in between. Here are some ways in which one can manage to improve the output of their diagrams:
- Simplicity: Do not be overcrowded by containing only those objects which are necessary and the relationship between them.
- Priority: Elementary Aspect: Understandability–The diagram must be easy to read and interpret and better if the names are as clear as possible.
- Symbol Usage: The symbols should be of the same shape, size, and lines to make them look professional and uniform.
- Be Sensitive of Scale: This will be particularly important especially where the diagram shows real life representation of scaled down structures.
- Iterate: Along with the application development process and acquiring additional data, it is ideal to update the diagram from time to time.
Case Studies
Case Study 1: Architectural Design
A bubble diagrams was made by an architectural firm in showing the design of a new community center. The chart enabled the stakeholders to be aware of the spatial interconnection between the various zones like the gymnasium, library, and other meeting halls. Thus, arranging the bubble sizes and positions, the team would be able to comprehend different layouts and choose the most suitable one taking into account space and navigational convenience.
Case Study 2: Urban Planning
A city planning department used different bubble diagrams to reshape a public park for its inhabitants. From the diagram, there are marked areas as playgrounds, picnic area, and the walking trail, among others. Through a manipulation of this arrangement, the planners could satisfy the maximization of recreational places with green places hence satisfying the users of the park.
Case Study 3: Interior Design
A layout based on the scheme of a heap shown in the figure was worked out in a client’s living room by an interior designer. Here, the use of the diagram made both the designer and the client have a better understanding of the positioning of various items like sofa, coffee table and television among others. They were able to enjoy the result of labor and the time they spent making many changes in order to make the layout of the rooms beautiful and efficient.
Conclusion
Bubble diagrams are widely used and very effective for noting relations and hierarchy in various fields as spatial ones. However, by learning the method and using the right tools and resources, it is possible to come up with good and helpful bubble diagrams to be used when making decisions in a project as well as planning. For project managers, architects, designers, or analysts, bubble diagrams provide a perfect and intuitive way during building, interior design or construction of information relations and options. The diagrams included must be concise, understandable and do not have to be complex since the aim is to impact all stakeholders in one way or the other.


